Money
Visualizing Unequal State Tax Burdens Across America


Visualizing Unequal State Tax Burdens Across America
What percentage of your income goes into Uncle Sam’s pocket?
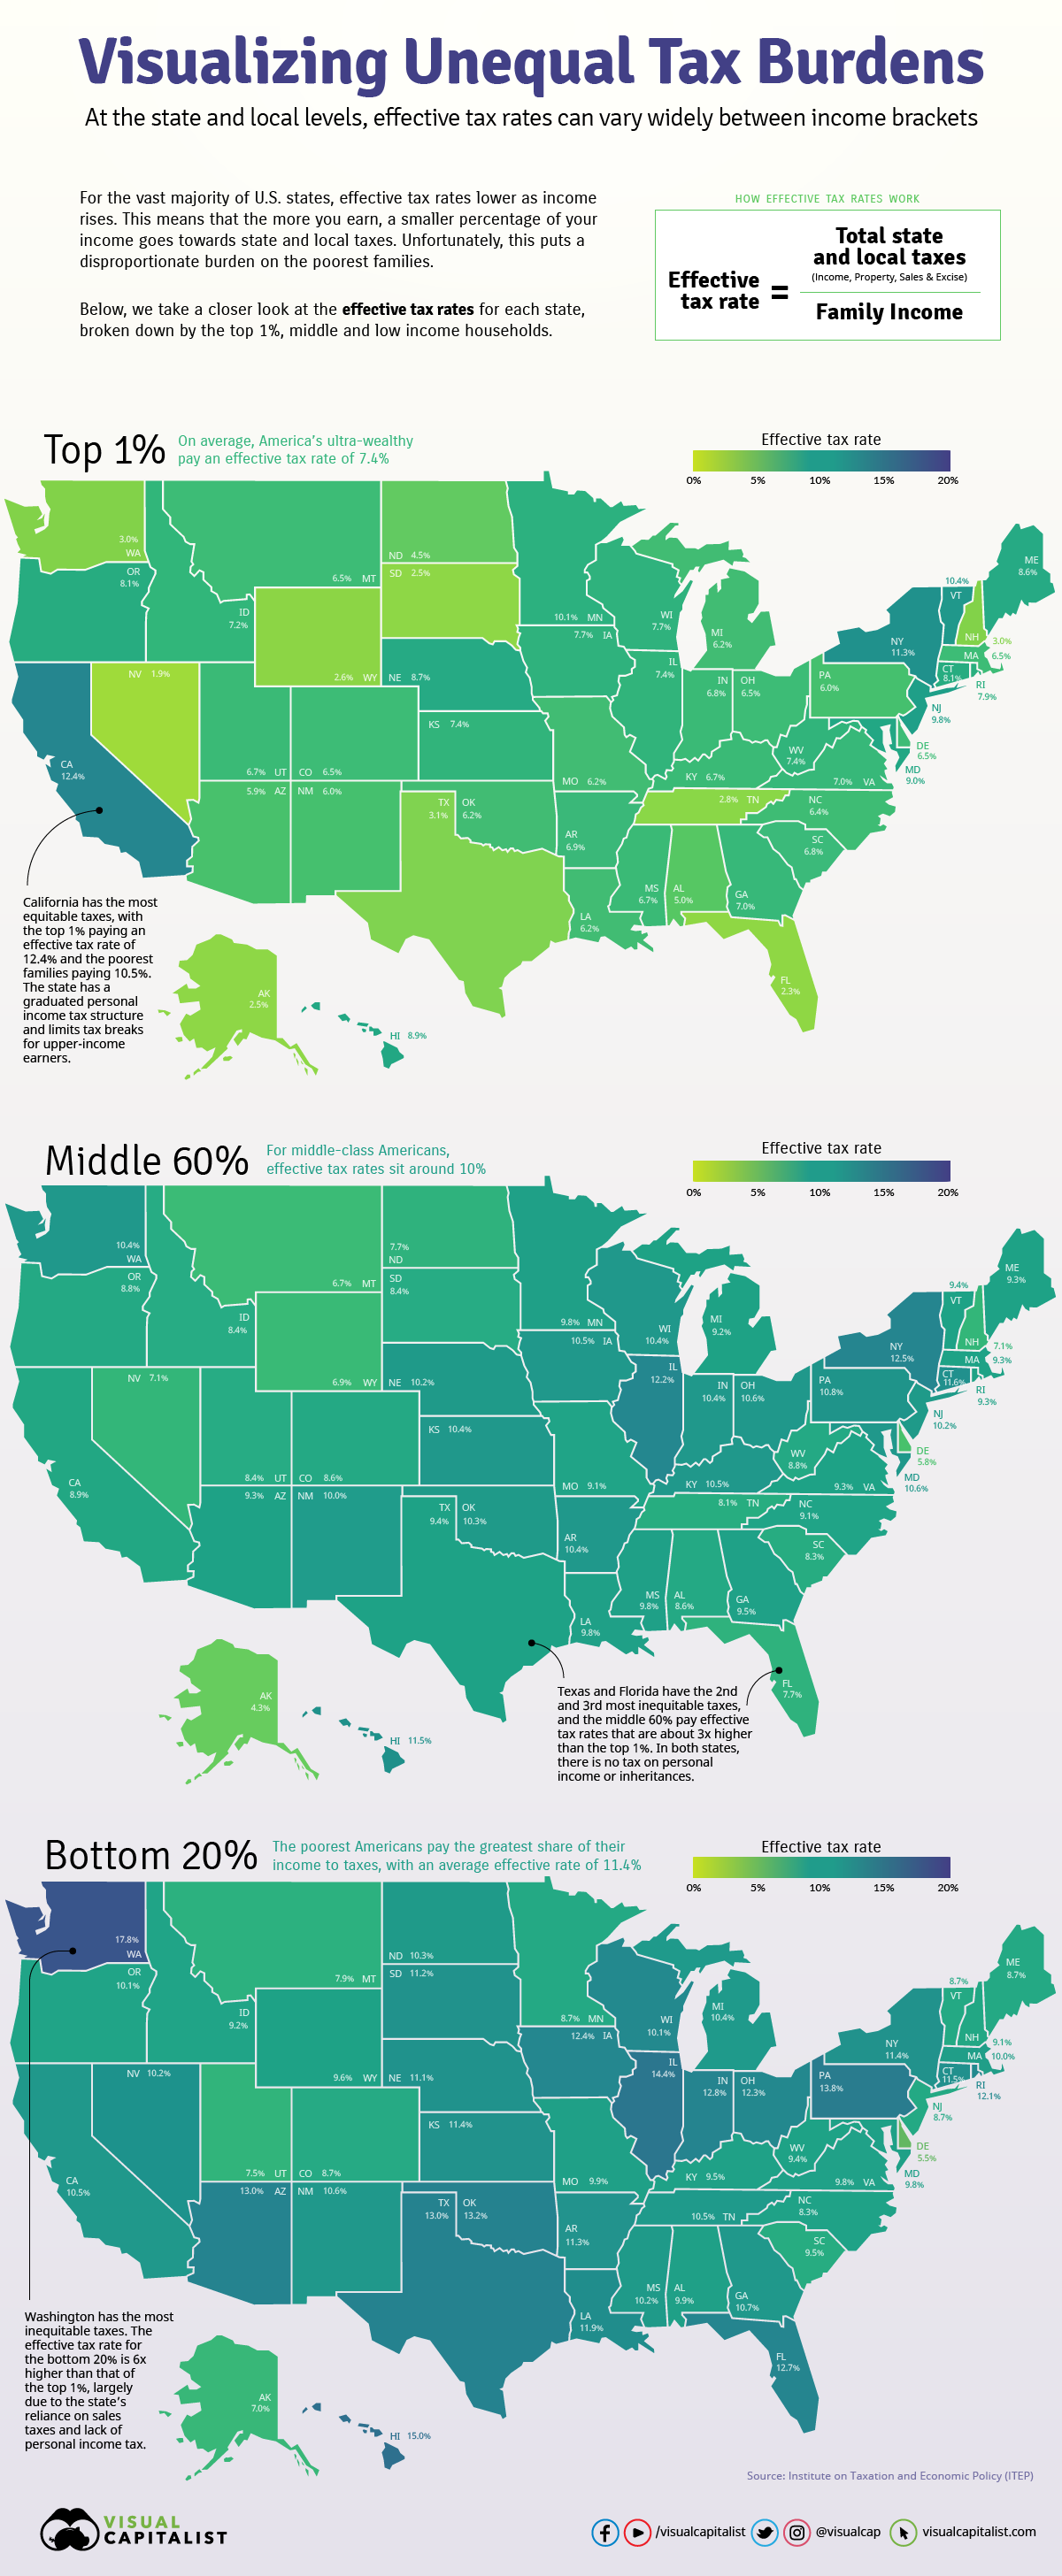
Your answer will vary depending on how much you earn. Data shows that low and middle-income families pay a much greater share of their income towards state and local taxes than wealthy families.
Today’s visualization uses data from the Institute on Taxation and Economic Policy (ITEP) to map the effective tax rates—or taxes paid as a share of family income—across income groups at the state and local level.
Crunching the Numbers
The data reflects the effect of tax changes enacted through September 10, 2018, using 2015 income levels (the latest year for available, detailed income data). Both single and married tax filers are included, while elderly taxpayers, dependent filers, and those with negative incomes are excluded.
Taxes Included
The report includes the state and local taxes for all 50 states and the District of Columbia. Taxes are broken into 3 broad groups:
- Consumption taxes – general sales taxes and specialized excise taxes
- Property taxes – including taxes on homes, businesses, and motor vehicles
- Income taxes – paid by individuals and businesses
Federal taxes are not considered.
Editor’s note: It’s worth noting that federal personal income tax has progressive rates, with the lowest earning bracket at 10% and the highest earning bracket at 37% in 2019. At a national level, property taxes are not charged and there is a very low reliance on excise taxes—both of which tend to be regressive as outlined below.
Income Included
The report includes both taxable and tax-exempt income such as worker’s compensation benefits. It also includes estimates for the amount of unreported income.
Which States Have the Most Unequal Tax Burdens?
Across the U.S., there is a wide disparity in how taxes affect different income groups. Here’s how it all breaks down, ranked in order of tax system inequality*:
Total State and Local Taxes As a Share of Income
By State and Income Group
| RANK | STATE | LOWEST 20% | MIDDLE 60% | TOP 1% |
|---|---|---|---|---|
| 1 | Washington | 17.8% | 10.4% | 3.0% |
| 2 | Texas | 13.0% | 9.4% | 3.1% |
| 3 | Florida | 12.7% | 7.7% | 2.3% |
| 4 | South Dakota | 11.2% | 8.4% | 2.5% |
| 5 | Nevada | 10.2% | 7.1% | 1.9% |
| 6 | Tennessee | 10.5% | 8.1% | 2.8% |
| 7 | Pennsylvania | 13.8% | 10.8% | 6.0% |
| 8 | Illinois | 14.4% | 12.2% | 7.4% |
| 9 | Oklahoma | 13.2% | 10.3% | 6.2% |
| 10 | Wyoming | 9.6% | 6.9% | 2.6% |
| 11 | Arizona | 13.0% | 9.3% | 5.9% |
| 12 | Indiana | 12.8% | 10.4% | 6.8% |
| 13 | Ohio | 12.3% | 10.6% | 6.5% |
| 14 | Louisiana | 11.9% | 9.8% | 6.2% |
| 15 | Hawaii | 15.0% | 11.5% | 8.9% |
| 16 | New Hampshire | 9.1% | 7.1% | 3.0% |
| 17 | North Dakota | 10.3% | 7.7% | 4.5% |
| 18 | Alabama | 9.9% | 8.6% | 5.0% |
| 19 | New Mexico | 10.6% | 10.0% | 6.0% |
| 20 | Arkansas | 11.3% | 10.4% | 6.9% |
| 21 | Iowa | 12.4% | 10.5% | 7.7% |
| 22 | Michigan | 10.4% | 9.2% | 6.2% |
| 23 | Kansas | 11.4% | 10.4% | 7.4% |
| 24 | Mississippi | 10.2% | 9.8% | 6.7% |
| 25 | Kentucky | 9.5% | 10.5% | 6.7% |
| 26 | Alaska | 7.0% | 4.3% | 2.5% |
| 27 | Georgia | 10.7% | 9.5% | 7.0% |
| 28 | Missouri | 9.9% | 9.1% | 6.2% |
| 29 | Connecticut | 11.5% | 11.6% | 8.1% |
| 30 | Massachusetts | 10.0% | 9.3% | 6.5% |
| 31 | North Carolina | 9.5% | 9.1% | 6.4% |
| 32 | Rhode Island | 12.1% | 9.3% | 7.9% |
| 33 | Virginia | 9.8% | 9.3% | 7.0% |
| 34 | Wisconsin | 10.1% | 10.4% | 7.7% |
| 35 | Colorado | 8.7% | 8.6% | 6.5% |
| 36 | Nebraska | 11.1% | 10.2% | 8.7% |
| 37 | West Virginia | 9.4% | 8.8% | 7.4% |
| 38 | Idaho | 9.2% | 8.4% | 7.2% |
| 39 | South Carolina | 8.3% | 8.3% | 6.8% |
| 40 | Utah | 7.5% | 8.4% | 6.7% |
| 41 | Oregon | 10.1% | 8.8% | 8.1% |
| 42 | Maryland | 9.8% | 10.6% | 9.0% |
| 43 | Montana | 7.9% | 6.7% | 6.5% |
| 44 | New York | 11.4% | 12.5% | 11.3% |
| 45 | Maine | 8.7% | 9.3% | 8.6% |
| 46 | New Jersey | 8.7% | 10.2% | 9.8% |
| 47 | Minnesota | 8.7% | 9.8% | 10.1% |
| 48 | Delaware | 5.5% | 5.8% | 6.5% |
| 49 | Vermont | 8.7% | 9.4% | 10.4% |
| 50 | District of Columbia | 6.3% | 9.8% | 9.5% |
| 51 | California | 10.5% | 8.9% | 12.4% |
* The ITEP Tax Inequality Index measures the effects of each state’s tax structure on income inequality. In states that rank high for inequality, incomes are less equal after state and local taxes are applied than before. On the flip side, states with the most equality are those where incomes are at least somewhat more equal after state and local taxes are levied than before.
Washington has the most unequal tax burdens. Proportional to their income, Washington taxpayers in the bottom 20% pay almost 6x more than those in the top 1%.
At the other end of the scale, California has the most equal tax system. As a share of their income, the state’s poorest families pay only 0.84x what the wealthiest families pay.
Overall, however, the vast majority of tax systems are regressive.
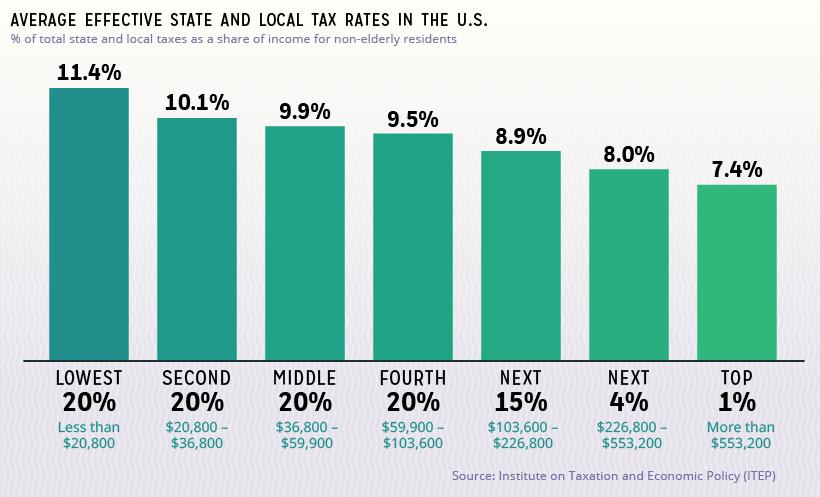
On average, the lowest 20% of income earners pay 1.54x more of their income in taxes compared to the top 1%.
The Main Causes
Two main factors drive a tax system’s (lack of) equality: how the state designs each tax, and the state’s reliance on different tax sources.
To better explain how this works, let’s take a closer look at each type of tax.
Sales & Excise Taxes
These taxes apply only to spent income, and exempt saved income. Since families with a higher household income are able to save a much larger percentage of their income, and the poorest families can barely save at all, the tax is regressive by nature.
The particular types of items that are taxed affect fairness as well. Quite a few states include food in their sales tax base, and low-income families spend the majority of their income on groceries and other necessities.
Not only that, excise taxes are levied on a small subset of goods that typically have a practical per-person maximum. For example, one person can only use so much fuel. As a wealthy family’s income increases, they generally do not continue to increase their spending on these goods.
States rely on these taxes more than any other tax source, which only exacerbates the problem.
Property Taxes
For the average household, the home makes up the majority of their total wealth—meaning most of their wealth is taxed. However, the wealth composition of richer families skews much more heavily towards stock portfolios, business equity, and other assets, which are exempt from property taxes.
While these types of assets are subject to taxes like capital gains and dividends, the distinction is that these taxes are levied only on earned gains. In contrast, property taxes are owed simply as a result of owning the asset.
What about those who don’t own homes? Landlords generally pass on the cost of property tax to renters in the form of higher rent. Since rent comprises a much higher share of expenses for poorer families, this makes property tax even more inequitable.
Income Taxes
State income taxes are typically progressive. This means effective tax rates go up as income goes up. Here’s how the U.S. averages break down:
- Low-income families: 0.04%
- Middle-income families: 2.1%
- Top 1%: 4.6%
However, certain policy choices can turn this on its head. Some states have a flat rate for all income levels, a lack of deductions and credits for low-income taxpayers, or tax loopholes that can be beneficial for wealthier income groups.
Nine states charge no income tax at all, garnering reputations as “low tax” states—but this is true only for high-income families. In order to make up for the lost revenue, states rely more heavily on tax sources that disproportionately affect the lowest earners.
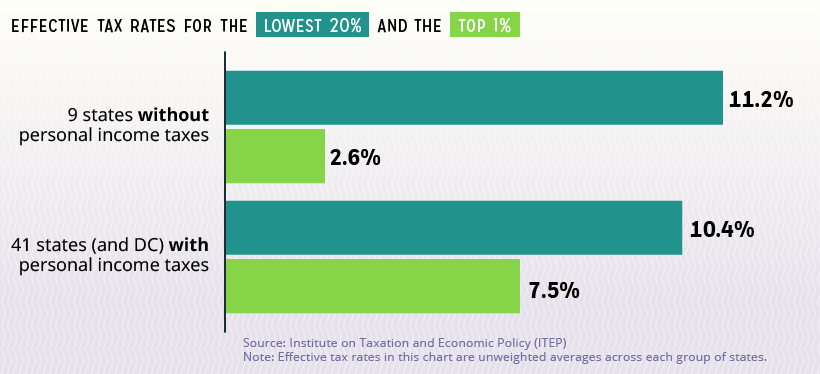
Evidently, states with personal income taxes have more equitable effective tax burdens.
Tackling Systemic Issues
Regressive state tax systems negatively impact the after-tax income of low and middle-income families. This means they have less to spend on daily expenses, or to save for the future.
Not only that, because wealthier families aren’t contributing a proportional share of tax dollars, state revenues grow more slowly.
For states looking to create a more equitable tax system, states with progressive systems offer some guidance:
- Graduated income tax rates
- Additional tax over a high-income threshold (e.g $1 million)
- Limits on tax breaks for upper-income taxpayers
- Targeted low-income tax credits
- Lower reliance on regressive consumption taxes
By implementing such policies, governments may see more tax equality—and more tax dollars for programs and services.
Hat tip to reddit user prikhodkop, whose visualization introduced us to this data.


Markets
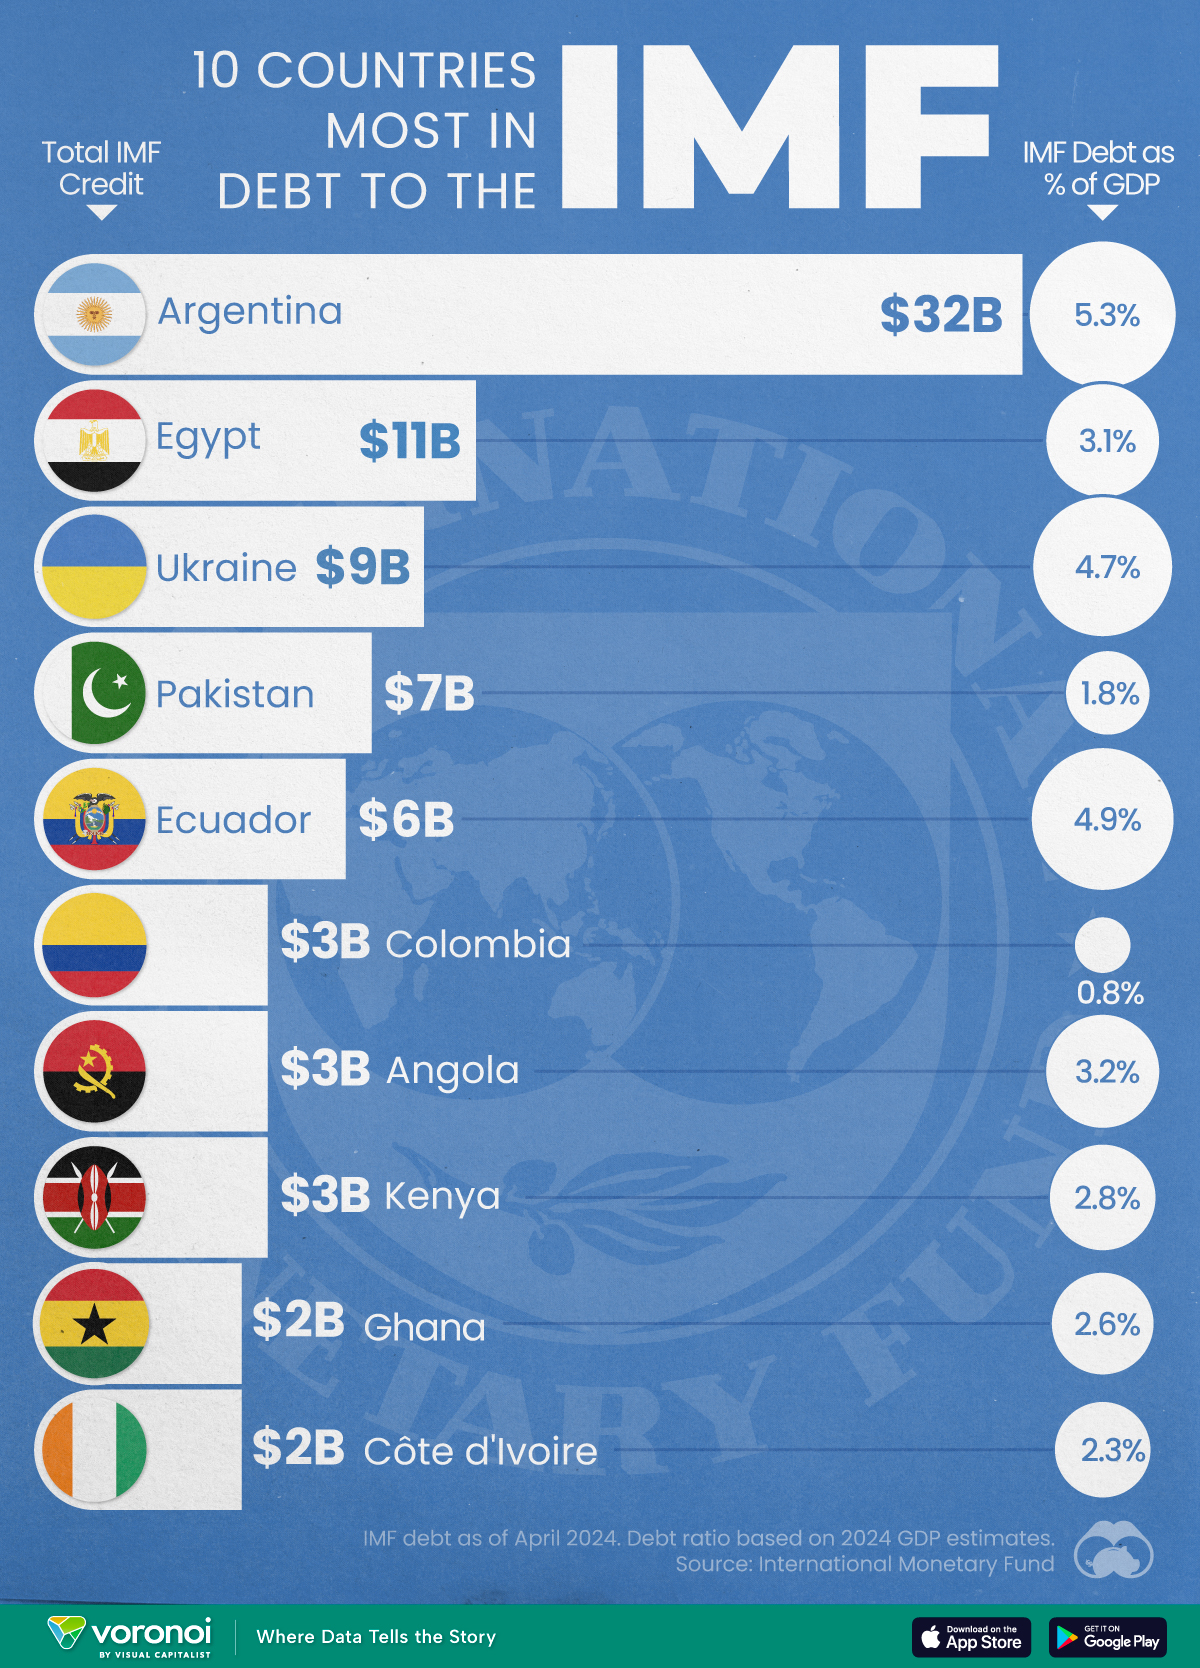
Top 10 Countries Most in Debt to the IMF
Argentina tops the ranking, with a debt equivalent to 5.3% of the country’s GDP.
Top 10 Countries Most in Debt to the IMF
This was originally posted on our Voronoi app. Download the app for free on iOS or Android and discover incredible data-driven charts from a variety of trusted sources.
Established in 1944, the International Monetary Fund (IMF) supports countries’ economic growth by providing financial aid and guidance on policies to enhance stability, productivity, and job opportunities.
Countries seek loans from the IMF to address economic crises, stabilize their currencies, implement structural reforms, and alleviate balance of payments difficulties.
In this graphic, we visualize the 10 countries most indebted to the fund.
Methodology
We compiled this ranking using the International Monetary Fund’s data on Total IMF Credit Outstanding. We selected the latest debt data for each country, accurate as of April 29, 2024.
Argentina Tops the Rank
Argentina’s debt to the IMF is equivalent to 5.3% of the country’s GDP. In total, the country owns more than $32 billion.
| Country | IMF Credit Outstanding ($B) | GDP ($B, 2024) | IMF Debt as % of GDP |
|---|---|---|---|
| 🇦🇷 Argentina | 32 | 604.3 | 5.3 |
| 🇪🇬 Egypt | 11 | 347.6 | 3.1 |
| 🇺🇦 Ukraine | 9 | 188.9 | 4.7 |
| 🇵🇰 Pakistan | 7 | 374.7 | 1.8 |
| 🇪🇨 Ecuador | 6 | 121.6 | 4.9 |
| 🇨🇴 Colombia | 3 | 386.1 | 0.8 |
| 🇦🇴 Angola | 3 | 92.1 | 3.2 |
| 🇰🇪 Kenya | 3 | 104.0 | 2.8 |
| 🇬🇭 Ghana | 2 | 75.2 | 2.6 |
| 🇨🇮 Ivory Coast | 2 | 86.9 | 2.3 |
A G20 member and major grain exporter, the country’s history of debt trouble dates back to the late 1890s when it defaulted after contracting debts to modernize the capital, Buenos Aires. It has already been bailed out over 20 times in the last six decades by the IMF.
Five of the 10 most indebted countries are in Africa, while three are in South America.
The only European country on our list, Ukraine has relied on international support amidst the conflict with Russia. It is estimated that Russia’s full-scale invasion of the country caused the loss of a third of the country’s economy. The country owes $9 billion to the IMF.
In total, almost 100 countries owe money to the IMF, and the grand total of all of these debts is $111 billion. The above countries (top 10) account for about 69% of these debts.

-

 Demographics7 days ago
Mapped: U.S. Immigrants by Region
-

 United States2 weeks ago
Charted: What Southeast Asia Thinks About China & the U.S.
-

 United States2 weeks ago
The Evolution of U.S. Beer Logos
-

 Healthcare2 weeks ago
What Causes Preventable Child Deaths?
-

 Energy2 weeks ago
Who’s Building the Most Solar Energy?
-

 Markets1 week ago
Mapped: The Most Valuable Company in Each Southeast Asian Country
-

 Technology1 week ago
Mapped: The Number of AI Startups By Country
-

 Healthcare1 week ago
Life Expectancy by Region (1950-2050F)